Turning Infographic Interest Into Social Followers & e-Book Sales
It’s no secret that images can be more powerful than words in marketing, but most companies don’t understand how to use visual presentations to create an impact that lasts longer than a single momentary impression.
By making the most of a custom-designed infographic, our team showed how information and design can come together to give viewers something that makes them hungry for more…
The Situation
At Kayak, we are always looking for new ways to engage readers, viewers, and potential clients. As part of that mission, we make note of interesting concepts or pieces of content that we come across.
Recently, we had noticed that infographics – one-page presentations that give an overview of the topic, idea, or viewpoint – were attracting interest (and shares) around the Internet. We recognized that the convenience of this medium didn’t just make it attractive to those seeking quick bits of information, it also encouraged them to pass along what they found.
Having identified an opportunity, the next logical step for us was to create an infographic of our own and see what kind of interest it could attract.
Action Taken
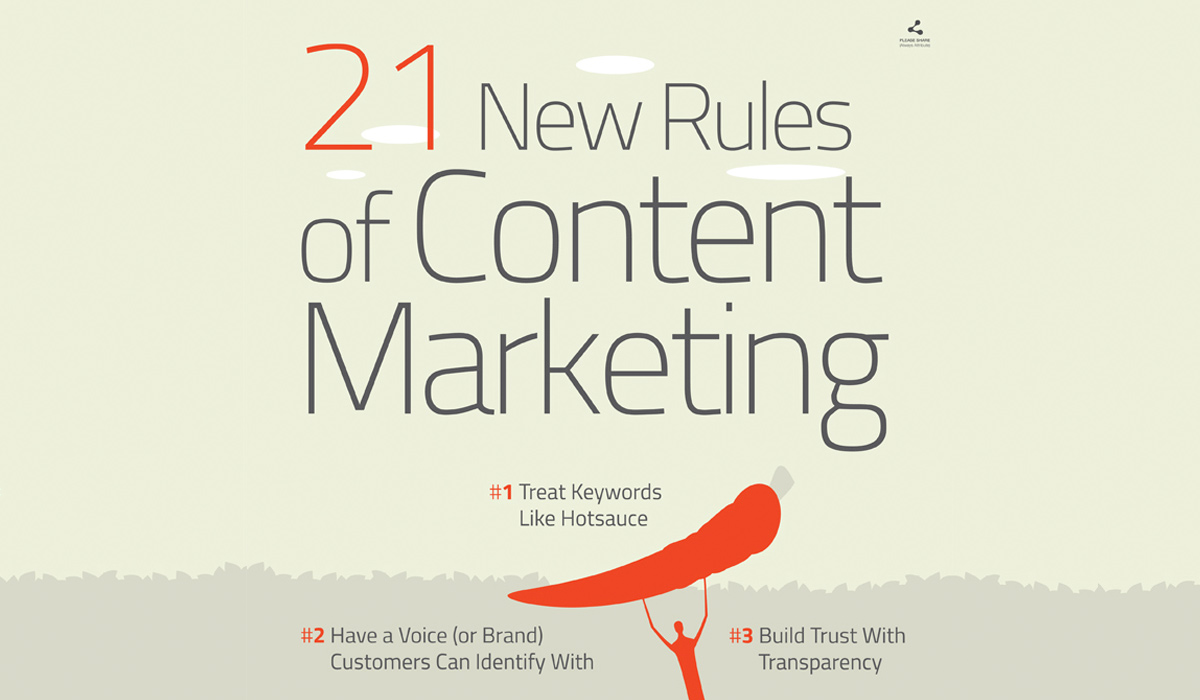
Because we had recently published a well-received e-book on findability, choosing the topic for our infographic was easy. We condensed the e-book’s main points into some easy-to-understand images, and then compiled these into an infographic (you can see it for yourself at slideshare.net) – which was to become a companion piece to a slide presentation we’d created earlier.
What we wanted wasn’t a comprehensive treatment of the topic, but an overview of the concept, a few critical points, and a couple of “teasers” that could draw viewers in a bit further.
The key is that we weren’t asking viewers to commit to reading an entire book, or even an article – instead, we gave them an easy and interactive way to broaden their knowledge on an important subject. We feel that this appeal to people’s sense of curiosity (along with a timely topic) was important to the infographic’s success, and something we’ll incorporate into future projects.
The Results
It didn’t take long for viewers to notice our infographic, or for its promotion to take on a life of its own. Within 24 hours, our presentation had made itself onto the “Featured” page, and was promoted as being “Hot on Twitter” by SlideShare. In the following 10 days, the infographic (and it’s companion slide presentation) attracted more than 10,000 views and 700+ shares via Twitter, embeds on several sites and discussion/postings in other mainstream social tools such as LinkedIn.
To put those numbers into perspective, 10,000 views isn’t really that much when compared to an infographic discussing Steve Jobs’ presntation tips which might receive over 100,000 views – but like anything we do in our online world – it’s all relative.
Imagine having 10,000 visits to your home page, or 10,000 comments on your blog. Those numbers start to mean something when your ideal customer is the one looking at it.
One of our core philosophies at KAYAK is that traffic should be a means to an end, and not a goal for its own sake. Naturally, we were interested to know how this infographic interest would translate into other, deeper conversion goals that would pull readers into our inbound lead generation sales funnel.
Looking more deeply into the data, we found that:
- More than 25% of those who tweeted about the infographic became new followers
- Views of the companion slide presentation rose by 626%
- Visits to our website rose by 22.03% (normally a late summer slump period)
- New business leads generated via our website rose by 33.78%
- A welcome side-benefit during that period, sales of the e-book the infographic was based on rose by 140 copies.
Although we expect we can do even better with a little bit of practice, all signs point to a resounding success, especially when it’s considered in proportion to the time, effort, and expense involved in creating the infographic, which was a whopping 45 minutes.
In the spirit of transparency, we concurrently leveraged rule #4 (Use the news) to raise awareness of the infographic and the book by tweeting with #inbound13 participants and attendees.
Any time we can find an efficient, interesting, and high-ROI online marketing strategy, that represents a “win” for our team and our clients. We look forward to seeing how we can take infographics even farther in the future.
Could your business benefit from marketing expertise, or just some fresh thinking about the best ways to attract attention from customers? If so, a free consultation with the Kayak team is just a call away. Let us show you what can be done to help transform your online presence into an effective tool for inbound lead generation.
Stats provided by SlideShare.net

{{cta(‘5438f6d9-9b6f-45cb-8505-c984dd3d9126’)}}